VXN Predictor
Demo
View Repository
Overview
VXN Predictor is a first-year machine-learning research project and Streamlit dashboard for exploring the CBOE Nasdaq-100 Volatility Index (VXN) and next-day forecasts.
It was developed for Move Tickers, a fictional client created by the university. The application combines historical market indicators, a point prediction, and an estimated forecast range to make model behaviour easier to inspect.
Problem
Volatility varies across market conditions, and a single forecast hides uncertainty. The project investigates whether engineered market and macroeconomic features can support next-day VXN estimates, and how to communicate those estimates alongside the observed outcome.
Data and Forecasting Task
The packaged datasets include VXN, Nasdaq-100 market data, commodities, exchange rates, and macroeconomic indicators. Feature engineering explores lagged observations, rolling statistics, and market-risk signals.
The target is a next-day VXN value. The application uses stored historical datasets; it does not currently ingest a live market-data feed.
Experiments and Served Model
The training notebook explores linear models, Lasso, tree-based methods, and neural networks. Its recorded tuned-model comparison places the neural network narrowly ahead of Linear Regression and Lasso on test RMSE. That experimental comparison is separate from the model selected by the dashboard implementation.
The dashboard serves a saved Lasso model for its point forecast. Separate quantile regressors estimate the 5th, 50th, and 95th percentiles. Input features are aligned to the stored feature order and transformed with the saved scaler before prediction.
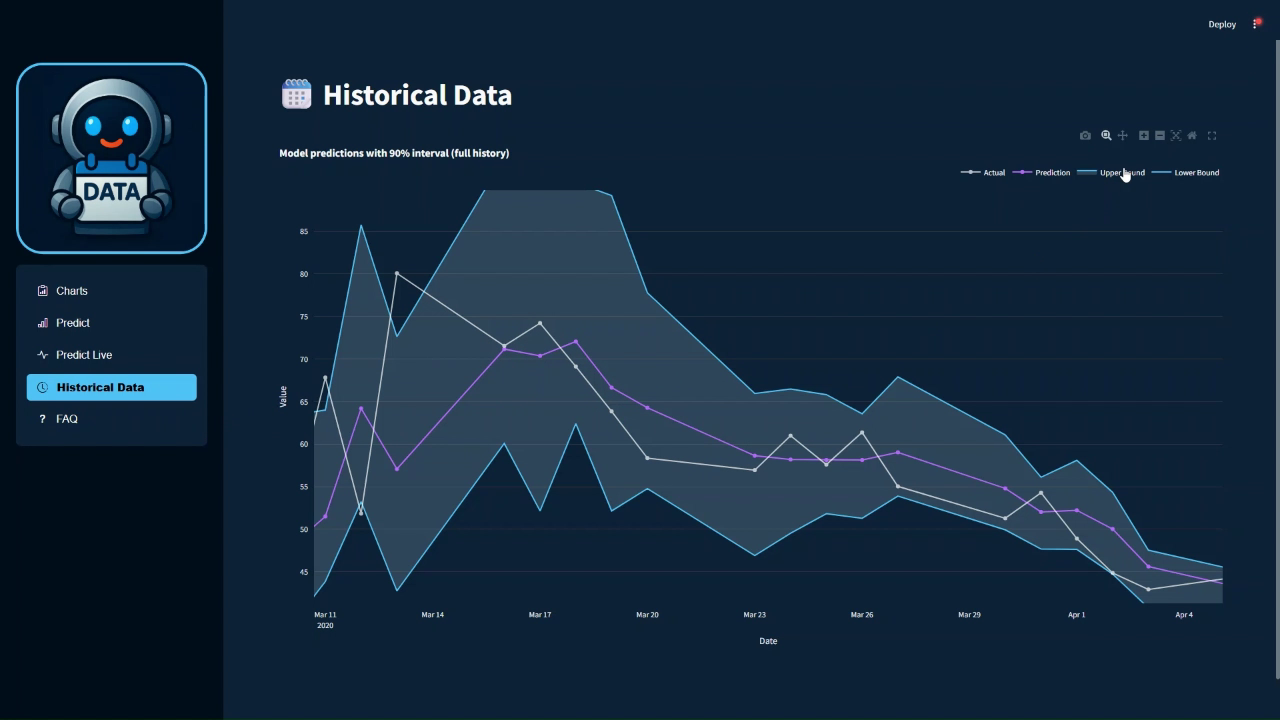
The notebook uses chronological 80/20 splits with shuffle=False and includes walk-forward experiments. Results from those experiments should be kept separate from the dashboard’s full-history display, which is not itself an out-of-sample backtest.
Forecast Views
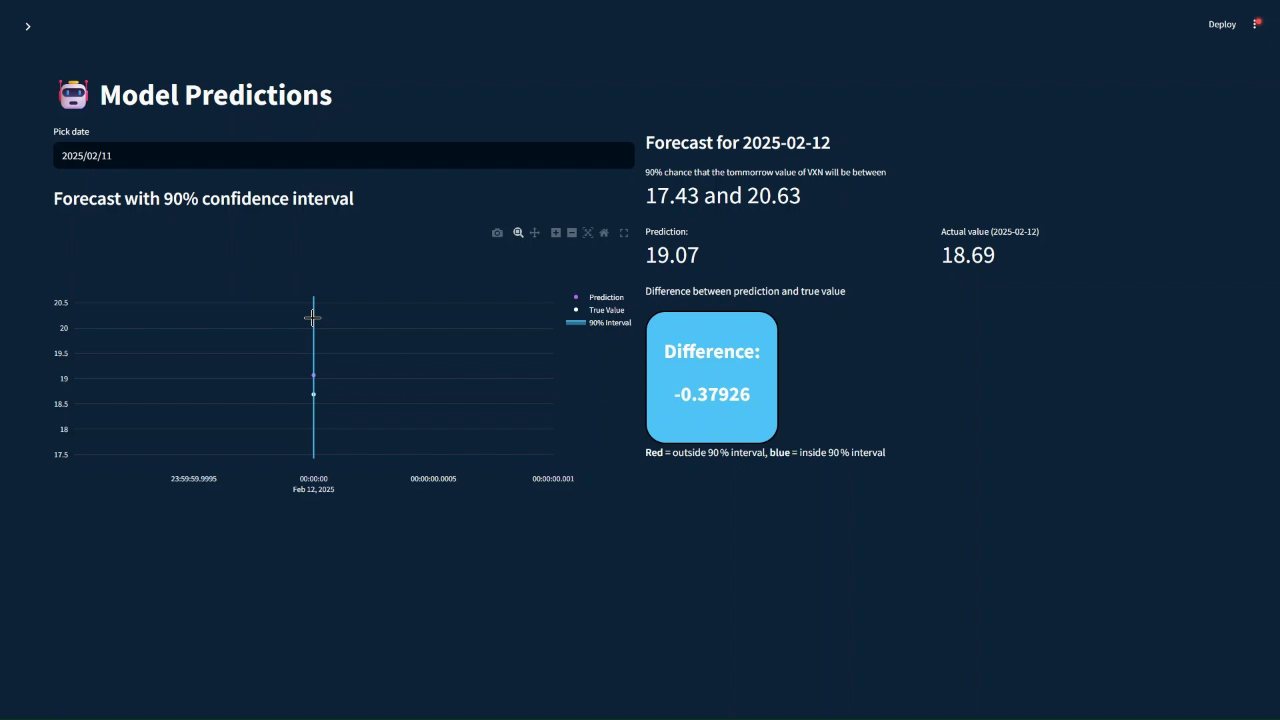
The bounds form a nominal 5th–95th percentile range. Their empirical coverage has not been established here, so the interface’s 90% wording should not be interpreted as a verified probability guarantee.
Dashboard and Software Design
- Interactive market-indicator charts and date-based forecast inspection.
- Historical comparison of predictions, observed VXN, and forecast bounds.
- FAQ explaining the target, feature choices, and model rationale.
- Separate modules for data preparation and model inference.
- Automated tests for data and model utilities.
Limitations and Next Steps
The Predict Live page is a placeholder. The current application is a historical-data prototype, and its forecasts have not been demonstrated to improve trading outcomes.
Further work would include a reproducible data-refresh pipeline, walk-forward evaluation with preprocessing fitted inside each training window, a persistence-baseline comparison on the same dates, and measurement of quantile coverage. Those checks would support a clearer judgement of forecasting performance across market regimes.
Engineering Takeaway
The project highlights the difference between model-selection experiments, the model actually served by an application, and the evidence needed to evaluate a time-series forecast. Communicating uncertainty is useful only when its meaning and validation are clear.
Implementation References
- Training and model comparisons.
- Lasso inference and quantile estimates.
- Dashboard implementation and documented limitations.
Tech stack: Python, Streamlit, Scikit-learn, Pandas, NumPy, Plotly, Joblib, Pytest.