SDG 6 - Safe Drinking Water Analytics Dashboard
Read the original analysis report for the project methodology, findings, and data-model evidence, including when the embedded dashboard is unavailable.
Overview
This first-year Power BI project explores access to safely managed drinking water in Southeast Asia, with a focus on Indonesia. It compares water-access indicators with GDP per capita and development assistance using the CRISP-DM framework.
The goal is to make regional differences and historical trends easier to inspect. The work is descriptive and exploratory: it examines associations, rather than estimating the causal effect of economic growth or aid on water access.
Analytical Questions
- How does safely managed drinking-water access vary across countries and years?
- How does it relate to GDP per capita in the selected data?
- How does population-adjusted development assistance change the comparison between Indonesia and Cambodia?
Data Preparation and Modeling
The analysis combines UN SDG water-access data, GDP per capita, financial flows for water and sanitation, and population data. The project covers historical observations through 2022, with availability varying by series and country.
Preparation involved resolving data types in Power Query, standardising country names, filtering the regional scope, and using Python to reshape wide tables into long format. Excel supported the average-change calculations described in the report.
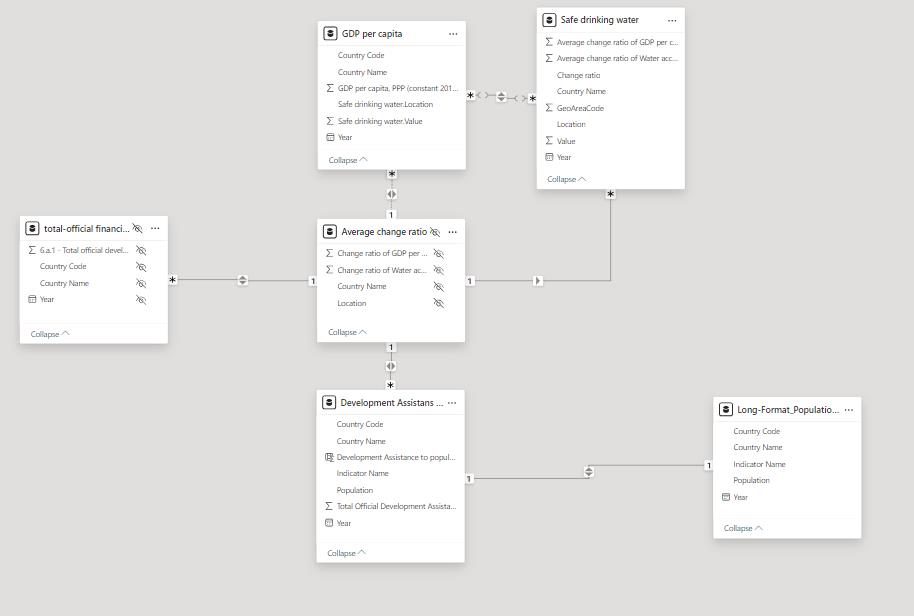
The model connects several tables with country and year fields. Relationship direction and differing data granularity matter when filtering the report or interpreting a combined visual.
Measures and Dashboard Design
| Measure | Interpretation |
|---|---|
| Safely managed drinking-water access | Share of the population using safely managed drinking-water services, expressed as a percentage |
| Median water access and GDP per capita | Median across countries in the selected regional data, used to reduce sensitivity to large differences between countries |
| Assistance per capita | Development-assistance amount divided by population, allowing comparisons beyond total funding |
Maps provide geographic context, line charts show change over time, and summary cards present regional medians. These views support comparison between countries without requiring the reader to inspect each source table directly.
Findings
The original report records a GDP/water-access correlation coefficient of 0.5589 for its comparison. This describes the selected historical analysis; it is not a causal estimate or a current regional statistic.
The Indonesia-Cambodia comparison also shows why absolute aid totals and population-adjusted values can tell different stories. The report uses differences in assistance per person to motivate further investigation, but the analysis does not establish that aid allocation caused the observed differences in water access.
Limitations and Next Steps
Country and rural/urban coverage is incomplete, and the report identifies missing data for Thailand. The available data therefore limits both regional comparisons and conclusions about within-country inequality.
Median summaries can hide variation, while a small set of economic indicators cannot represent governance, infrastructure, geography, or policy implementation. Time periods and filters must also be aligned before comparing measures.
Useful next steps include a documented refresh process, clearer measure definitions and date coverage inside the dashboard, and additional contextual indicators. The downloadable report preserves the original project evidence independently of the Power BI embed.
Engineering Takeaway
The main work lies in joining inconsistent international datasets, defining comparable measures, and communicating the limits of a descriptive analysis. A compelling chart needs traceable preparation and careful interpretation.
Sources and Project Evidence
- Original project report, preserved with this portfolio.
- UN SDG data portal.
- GDP per capita data and financial flows for water and sanitation.
- World Bank population data.
Tech stack: Power BI, Power Query, Excel, Python, Jupyter Notebook, CRISP-DM.